Week 11 – t-test
Statistical tests for differences: t -test
The t-test is one of the most common hypothesis tests in statistics. The t-test determines either whether the sample mean and the mean of the population differ or if two sample means differ statistically. The t-test distinguishes
Between
▪ One sample t-test
▪ t-test for independent samples
▪ t-test for dependent samples
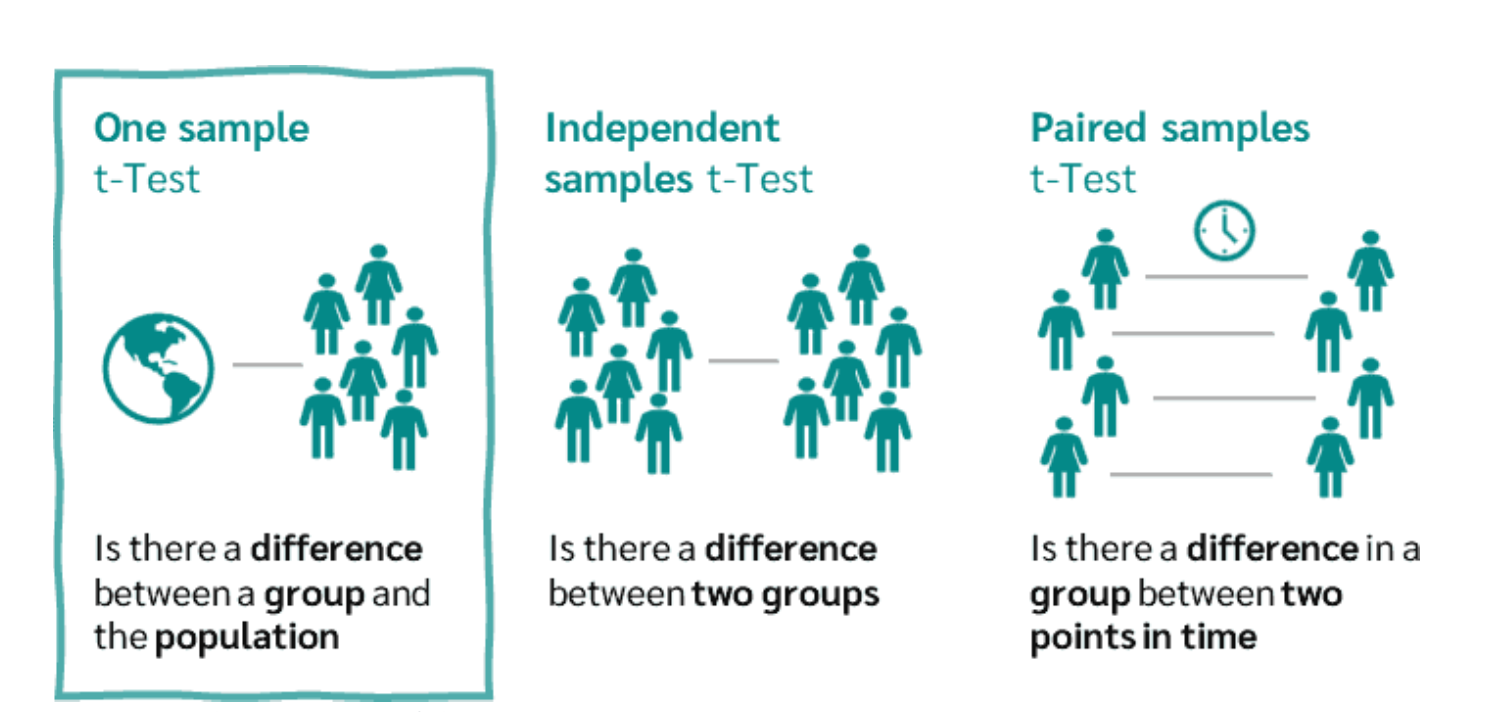
One sample Independent Paired samples t-Test samples t-Test t-Test Is there a difference Is there a difference Is there a difference in a between a group and between two groups the population group between two points in time Figure 66: The 3 variants of the t-test.
T-test for independent samples (unpaired t-test)
The unpaired t-test (also called the independent-samples t-test) is used to compare the means of two independent groups on a numeric outcome variable.
Typical research questions answered by an unpaired t-test are:
Do two groups differ in their average value?
Is the mean outcome in group A different from the mean outcome in group B?
Examples include comparing mean marks between students who exercise and those who do not, average health scores for people with and without a degree, or the mean weight of products produced by two different machines.
What does “independent samples” mean?
Two samples are independent when no individual appears in both groups.
This means that membership of one group rules out membership of the other group.
Examples of independent samples include:
different people in two conditions (e.g. treatment vs control),
different groups defined by a categorical variable (e.g. degree vs no degree),
different objects or items measured once (e.g. screws from two machines).
If the same individuals are measured twice (for example, before and after an intervention), the samples are not independent and a paired t-test must be used instead.
The purpose of the unpaired t-test
The unpaired t-test evaluates the difference between two sample means in relation to how much variability we would expect by chance alone.
It does this by comparing:
the observed difference between the two group means, and
the standard error of the difference, which reflects how much sample means are expected to vary from sample to sample.
If the mean difference is large relative to its standard error, the observed difference is unlikely to be due to random sampling variation, and this provides evidence against the null hypothesis.
In simple terms:
Larger mean differences and smaller variability make it less likely that the observed difference occurred by chance.
Research question and hypotheses
Before carrying out an unpaired t-test, the research question must be stated clearly.
For independent samples, the general research question is:
Is there a statistically significant difference between the means of two groups?
From this question, we define two competing hypotheses about the population means.
Null hypothesis (H₀)
There is no difference between the population means of the two groups.
Formally:
H₀: μ₁ = μ₂
Alternative hypothesis (H₁)
There is a difference between the population means of the two groups.
Formally:
Two-sided (non-directional):
> H₁: μ₁ ≠ μ₂One-sided (directional, if specified in advance):
> H₁: μ₁ > μ₂
> H₁: μ₁ < μ₂
Hypotheses are always stated in terms of population parameters, not sample statistics.
When should you use an unpaired t-test?
You should use an unpaired (independent-samples) t-test when:
the outcome variable is numeric (e.g. marks, scores, weights),
the explanatory variable has two categories,
the two groups are independent,
you want to compare group means.
The choice of test is determined by the study design, not by the observed data values.
What to report from an unpaired t-test
When reporting the results of an unpaired t-test, you must include both descriptive and inferential information.
1. Descriptive statistics (always first)
Report the sample size, mean, and standard deviation for each group.
Example:
Students who exercised (n = 108, M = 72.5, SD = 6.4) scored higher on average than students who did not exercise (n = 92, M = 55.8, SD = 7.1).
This describes what was observed in the sample.
2. The test result
Report:
the type of test,
the test statistic (t),
the degrees of freedom (df),
the p-value (p)
Example:
An independent-samples t-test showed that this difference was statistically significant, t(198) = 20.90, p < 0.001.
This addresses whether the observed difference is unlikely under the null hypothesis.
3. The confidence interval
Report the 95% confidence interval for the mean difference.
Example:
The 95% confidence interval for the mean difference ranged from 15.1 to 18.3 marks.
The confidence interval indicates which population differences are plausible given the data.
4. A clear conclusion in words
Your conclusion should:
refer back to the research question,
state whether there is evidence of a difference,
avoid causal language unless the study design justifies it.
Example:
There is strong evidence that students who exercise score higher on average than those who do not. The difference is unlikely to be due to chance alone.
An unpaired \(t\)-test can show that two groups differ on average, but it does not by itself show that one variable causes the other.
Unless the study design involves random assignment and controlled conditions, causal language is not justified.
Avoid saying
- “Exercise causes higher marks.”
- “Having a degree leads to better health.”
- “The treatment improves outcomes.”
- “Group A results in higher scores than Group B.”
These statements imply cause-and-effect, which an independent-samples \(t\)-test alone cannot establish.
Say instead
- “Students who exercise score higher on average than those who do not.”
- “There is a difference in mean health scores between people with and without a degree.”
- “The two groups differ significantly in their mean outcomes.”
- “The observed difference is unlikely to be due to chance alone.”
These statements correctly describe evidence of an association or difference, without overclaiming causality.
Key rule
Statistical significance does not imply causation.
Always match your language to what the study design can support.
A complete reporting template
Group A (n = …, M = …, SD = …) and Group B (n = …, M = …, SD = …) were compared using an independent-samples t-test.
The difference in means was statistically significant, t(df) = …, p = ….
The 95% confidence interval for the mean difference was […, …].
This suggests that, in the population, the mean outcome differs between the two groups.
In the reporting template above:
- n = sample size (number of observations in each group)
- M = sample mean (average value in the group)
- SD = sample standard deviation (how spread out the values are)
- t = \(t\)-test statistic
- df = degrees of freedom for the test
- p = p-value (evidence against the null hypothesis)
- 95% confidence interval = range of population mean differences that are plausible given the data
Remember:
- M and SD describe the sample.
- The conclusion refers to the population.
Key takeaway
The unpaired t-test answers one question:
Is the observed difference between two group means larger than we would expect by chance alone?
Understanding the design, logic, and reporting structure is more important than memorising formulas.