Exponentials & Logs
These problems look at exponentials and logs, exploring how they’re used to model various real-world phenomena. You’ll need a scientific calculator and a graphing tool like Geogebra or Desmos.
1 Calculations
These questions review how exponentials and logarithms are used in calculations and visualisations.
2 Modelling
Within humanities and social sciences, our main interest in exponentials and logs is how they can be used to model complicated phenomena.
2.1 Continuous Interest
Given an initial investment \(Q\) with an interest rate of \(r\), the amount of money at time \(t\) can be found as \[ P(t) = Q e^{rt}. \] This is a type of compound interest.
If the initial investment was £100, with a continuous interest rate of 1.7% applied daily, how much money would there be after 365 days?
Using a tool of your choice, plot \(y = P(x)\). What is the meaning of the \(y\)-intercept?
Plot \(y = P(x)\) with a logarithmic \(y\)-axis. What’s the gradient now?
2.2 Population Growth
Given an initial population size \(P_0\), a growth rate \(r\) per day, and a maximum feasible population size \(K\), the population on day \(t\) is modelled logistically as
\[ P(t) = \frac{P_0 \cdot K}{P_0 + (K - P_0)e^{-rt}}. \]
Plot this model for \(P_0 = 10\), \(K = 500\), and \(r = 0.5\).
What is the range of this model for a domain \(t\geq0\)?
What happens if we extend the domain to \(t < 0\)?
2.3 Sound
You may have heard of decibel as a measure of how ‘loud’ something is. You may even have seen a chart like the one below that compare different sounds.
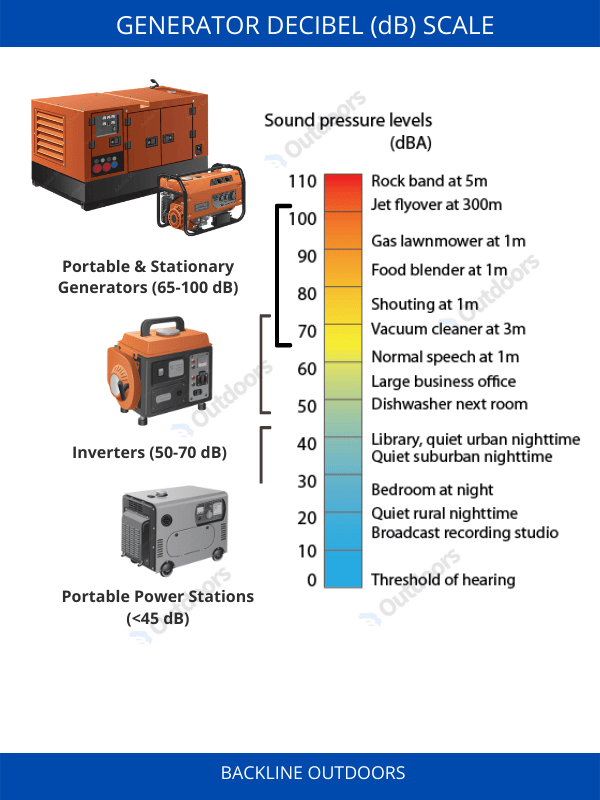
What you might not known though is that decibels are a logarithmic scale, defined by the equation \[ d = 10\log\left(\frac{p}{p_{0}}\right). \] Here \(p\) is the intensity or power of the sound (measured in Watts), \(p_0\) is intensity of the faintest audible sound, and \(d\) is volume in decibels.
Using this equation with \(p_0 = 1\) Watt, create a version of the graphic above that uses power, rather than decibels, to measure the sound.